Anthropogenic GHG Emissions: Definition and Context
Anthropogenic greenhouse gas (GHG) emissions are those stemming directly or indirectly from human activities; chiefly the extraction and combustion of fossil fuels (coal, oil, natural gas), industrial processes (cement production, chemical manufacturing), agricultural practices (rice paddies, livestock enteric fermentation), land-use change (deforestation, soil disturbance), and waste management. When fossil carbon is released to the atmosphere as carbon dioxide (CO₂) or when methane (CH₄) and nitrous oxide (N₂O) escape from agricultural and industrial sources, these gases trap outgoing infrared radiation, enhancing Earth’s natural greenhouse effect and driving anthropogenic climate change.
Rising Atmospheric CO₂ Since the Pre-Industrial Era
By the end of 2019, atmospheric CO₂ levels reached 412 ppm; nearly 50 percent higher than the pre-industrial baseline of 278 ppm, underscoring the unprecedented pace of human-driven change over just two centuries. As CO₂ concentrations climb, average global temperatures have already warmed by approximately 1.1 °C above pre-industrial norms, and ocean heat content has surged to historic highs. This shift not only alters weather patterns and intensifies extreme events but also acidifies seawater and disrupts critical ecosystem services worldwide.
NASA’s “Vital Signs” on Carbon Dioxide
According to NASA’s Vital Signs of the Planet, in March 2025 the latest measurement of atmospheric CO₂ stood at 428 ppm, well over 150 percent of its 1750 level, reflecting the aggregate effect of anthropogenic emissions accumulated since the Industrial Revolution. These data derive from two complementary sources: direct measurements at NOAA’s Mauna Loa Observatory (continuous since 1958) and proxy reconstructions from air bubbles trapped in ice cores, which extend the record back hundreds of thousands of years. Together, they reveal both the sharp upward rise of CO₂ over modern times and the natural swings driven by glacial-interglacial cycles.
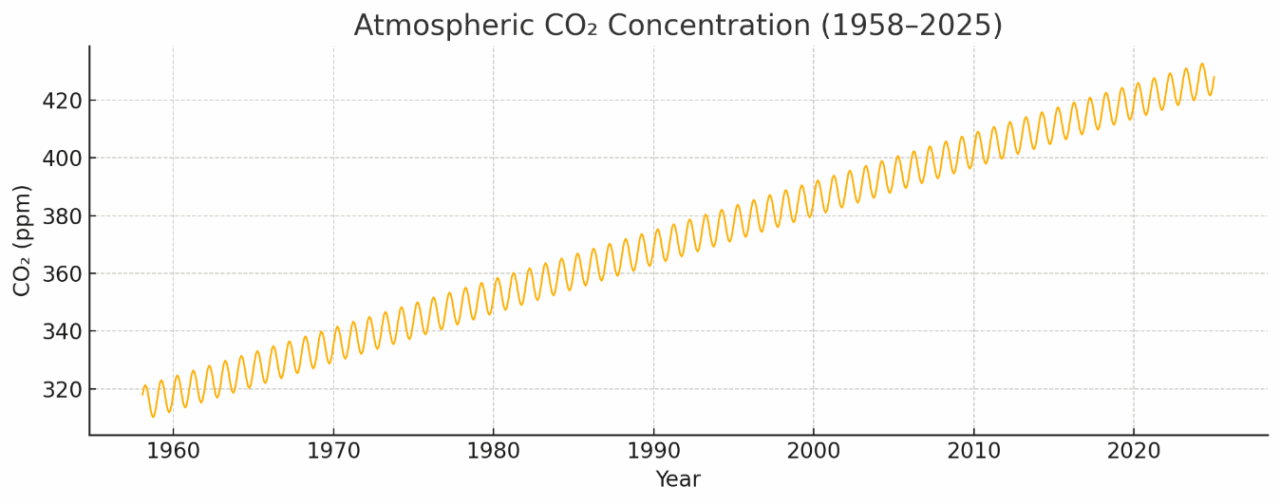
Figure 1. Atmospheric CO₂ concentration at Mauna Loa (1958-2025), showing both the long-term rise and the annual draw-down/release cycle.
Seasonal Cycles and Long-Term Trends
Superimposed on the steady upward trend is a pronounced annual “sawtooth” pattern: during Northern Hemisphere spring and summer, vigorous plant photosynthesis draws down CO₂, causing levels to dip, whereas autumnal decay returns CO₂ to the air. The magnitude of these swings, about 6-8 ppm each year, reflects the leafy biomass rhythm, predominantly in mid-latitude vegetation. Despite this seasonal breathing of the biosphere, the overall trajectory remains sharply positive, driven by continued fossil-fuel combustion and land-use change. The contrast between the modest natural wiggles and the overarching upward climb powerfully illustrates humanity’s dominant role in reshaping Earth’s atmosphere.
Implications and Path Forward
The documented rise in CO₂ not only serves as a clear indicator of anthropogenic influence but also provides a vital benchmark for tracking mitigation progress. By quantifying emissions and removals as CO₂-equivalent value, and monitoring trends through robust, long-duration observations, policymakers, businesses, and individuals can set informed targets, evaluate the effectiveness of interventions (energy efficiency, renewable deployment, reforestation), and adjust strategies in real-time. Transparent, science-based tracking underpins global agreements and national commitments aimed at stabilizing greenhouse gas levels.
For more detailed, up-to-date information on atmospheric carbon dioxide measurements and trends, including interactive graphs and downloadable datasets, please see NASA’s Vital Signs: Carbon Dioxide: https://climate.nasa.gov/vital-signs/carbon-dioxide/?intent=12

Researcher and Data strategist with more than 13 years experience, Auditor of Management Systems, specializing in energy efficiency and GHG emissions reporting
